
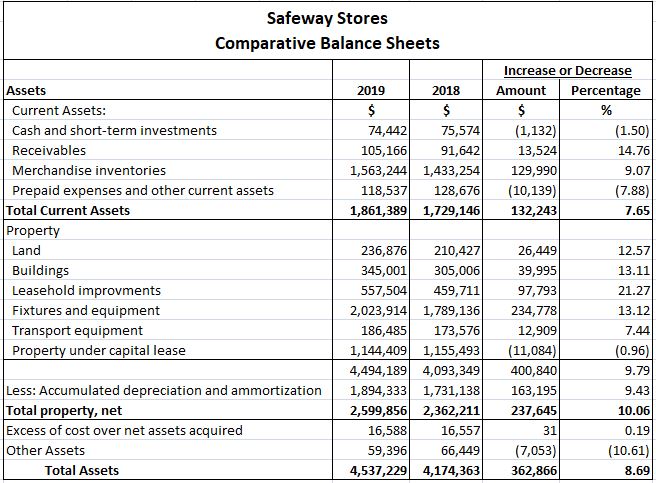
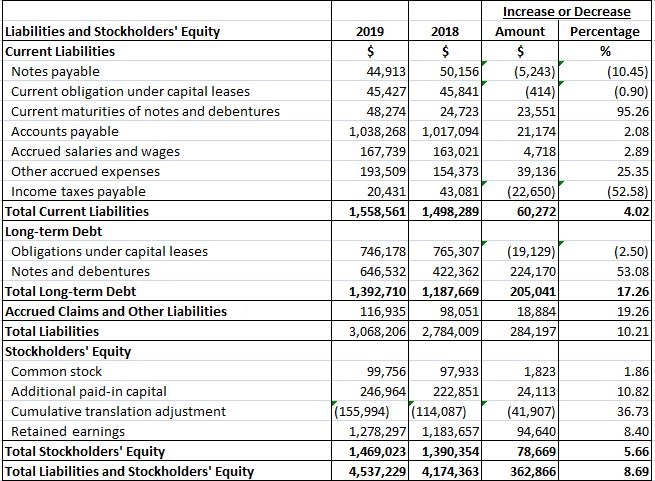
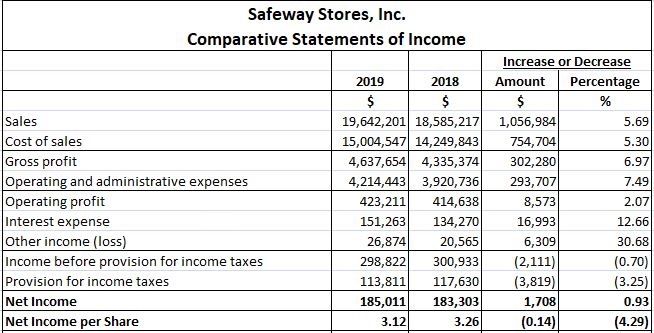
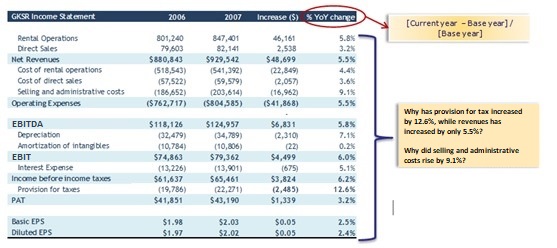
Horizontal analysis is an approach to analyzing financial statements. It compares historical data, which includes ratios and line items, over a series of accounting periods. The accounting period can be a month, a quarter, or a year. This method of analysis is also known as trend analysis. The horizontal method of analysis is used to identify changes in financial statements over time and assess those changes. A base year is initially selected as a benchmark. Either the data of the rest of the years is expressed as a percentage of the base year or an absolute comparison is performed. The base year comparison is known as base year analysis. This method of analysis makes it easy for the financial statement user to spot patterns and trends over the years. An absolute comparison involves comparing the amount of the same line of the item to its amounts in the other accounting periods. For example, comparing the accounts receivables of one year to those of the previous year. Any changes are analyzed then. In percentage comparison, the increase or decrease in amounts is expressed as a percentage of the amount in the base year. For example, if the base year amount of cash is $100, a 10% increase would make the current accounting period’s amount $110, whereas a 10% decrease would be $90. Different ratios, such as earnings per share (EPS) or current ratio, are also compared for different accounting periods. Horizontal analysis focuses on the dollar and percentage changes that occur in specific accounts from year to year. Determining the percentage change is important because it links the degree of change to the actual amounts involved. In this way, percentage changes are better for comparative purposes with other firms than are actual dollar changes. For example, a $1 million increase in General Motors' cash balance is likely to represent a much smaller percentage increase than a corresponding $1 million increase in American Motors' cash balance. To calculate percentage changes, you can use the following formula: Percentage change = (Amount of dollar change / Base year amount) x 100 The base year is always the first year in the comparison. For example, suppose that Safeway's total current assets were $1,729,146,000 in 2018 and $1,861,389,000 in 2019. This represents a dollar increase of $132,243,000 and a percentage increase of 7.65%, which is calculated as follows: Percentage change = ($1,861,389,000 - $1,729,146,000 / 1,729,149,000) x 100 = 7.65% You can also use horizontal analysis in conjunction with both the balance sheet and the income statement. In the example shown below, comparative balance sheets and income statements are given for Safeway Stores. The tables show the dollar and percentage changes. Several interesting balance sheet changes are apparent in the tables below. In 2019, Safeway Stores increased its operating of fixed assets. There were rises of more than 12% in all categories of property other than transport equipment. This increase in capital expenditures is also reflected on the liability side of the balance sheet. In particular, notes and debentures increased by over 53%. In this discussion and analysis of operations, Safeway's management noted that the increase was due to a growing trend toward mortgage financing. Horizontal analysis of income statements also produces worthwhile information. For example, in Safeway Stores' balance sheets, both sales and the cost of sales increased from 2018 to 2019. However, the percentage increase in sales was greater than the percentage increase in the cost of sales. This led to an increase in gross profit from 2018 to 2019. Operating and administrative expenses also increased slightly and interest expense increased by over 12%. This resulted in only a slight increase in net income for 2019 over 2018. Consistency and comparability are generally accepted accounting principles (GAAP). Consistency is important when performing horizontal analysis of financial statements. When the same accounting standards are used over the years, the financial statements of the company are easier to compare and trends are easily analyzed. Comparability means that a company’s financial statements can be compared to those of another company in the same industry. Horizontal analysis enables investors, analysts, and other stakeholders in the company to see how well the company is performing financially. A company’s financial performance over the years is assessed and changes in different line items and ratios are analyzed. Negative changes and trends are further investigated. Horizontal analysis also makes it easier to detect when a business is underperforming. For example, if a company starts generating low profits in a particular year, expenses can be analyzed for that year. This makes it easier to spot inefficiencies and specific areas of underperformance. Ratios such as asset turnover, inventory turnover, and receivables turnover are also important because they help analysts to fully gauge the performance of a business. For example, a low inventory turnover would imply that sales are low, the company is not selling its inventory, and there is a surplus. This could also be due to poor marketing or excess inventory due to seasonal demand. Ratios such as earnings per share, return on assets, and return on equity are similarly invaluable. These ratios make problems related to the growth and profitability of a company evident and clear. Liquidity ratios are needed to check if the company is liquid enough to settle its debts and pay back any liabilities. Horizontal analysis makes it easy to detect these changes and compare growth rates and profitability with other companies in the industry. Let’s take a look at this simple example before we discuss any further. Each item in a financial statement is compared to the base year. In this case, if management compares direct sales between 2007 and 2006 (the base year), it is clear that there is an increase of 3.2%. This result would be concerning for the company's management. They would investigate this if they expected at least a 10% increase. To provide another example, consider an investor who is seeking to invest and finds company C. Company C’s figures for the previous year are as follows: net income $2m and retained earnings $10m. The current year's details are the following: net income $4m and retained earnings $12m. Net income has grown by 100% and retained earnings have increased by only 20%. The investor now needs to make a decision based on their analysis of the figures, as well as a comparison to other similar figures. Regardless of how useful trend analysis may be, it is regularly criticized. One reason is that analysts can choose a base year where the company's performance was poor and base their analysis on it. In this way, the current accounting period (or any other accounting period) can be made to appear better. Another problem with horizontal analysis is that some companies change the way they present information in their financial statements. This can create difficulties in detecting troublesome areas, making it hard to spot changes in trends. To conclude, it is always worth performing horizontal analysis, but it should never be relied upon too heavily. Other factors should also be considered, and only then should a decision be made.Horizontal Analysis: Definition
Horizontal Analysis: Explanation
Comparative Balance Sheets With Horizontal Analysis
Comparative Income Statements With Horizontal Analysis
The Usefulness of Horizontal Analysis
Example
Criticisms of Horizontal Analysis
Horizontal Analysis: Discussion
Horizontal Analysis of Financial Statements FAQs
Horizontal analysis is the use of financial information over time to compare specific data between periods to spot trends. This can be useful because it allows you to make comparisons across different sets of numbers.
By looking at the numbers provided by a company, you should see whether there are any large differences between one year and the next. It is also possible to perform this analysis with time series data to make direct comparisons with other companies.
When Financial Statements are released, it is important to compare numbers from different periods in order to spot trends and changes over time. This can be useful in checking whether a company is performing well or badly, and identify areas where it may improve.
Horizontal analysis involves looking at Financial Statements over time in order to spot trends and changes. This can be useful in identifying areas of concern for a business, as well as improving the performance of companies that are struggling.
Horizontal analysis is important because it allows you to compare data between different periods and makes it easier to identify changes in trends. This can be helpful in making decisions about whether to invest in a company or not.
True Tamplin is a published author, public speaker, CEO of UpDigital, and founder of Finance Strategists.
True is a Certified Educator in Personal Finance (CEPF®), author of The Handy Financial Ratios Guide, a member of the Society for Advancing Business Editing and Writing, contributes to his financial education site, Finance Strategists, and has spoken to various financial communities such as the CFA Institute, as well as university students like his Alma mater, Biola University, where he received a bachelor of science in business and data analytics.
To learn more about True, visit his personal website or view his author profiles on Amazon, Nasdaq and Forbes.


